I’m going to admit it up front. I don’t hate romantic comedies. Love Actually could be one of the best movies ever made. Whether it’s the storyline, the writing, the directing, the music, or the acting, sometimes a good romantic comedy is just the thing we need on cold winter night by the fire. I’m here to talk about one sliver of the formula: the actors and actresses. We all know the group of actors that show up in romcom after romcom. Is that the reason we keep coming back? The adept acting of Meryl Streep? The irresistible good looks of Bradley Cooper? Whatever the reasons are, I haven’t figured them out. While I can’t tell you why we like a specific actor, I dug deep into the data to prepare myself to tell you which actors we value the most (and the least).
Before I get started, I want to switch gears for a second to basketball to provide my reasoning behind the method I used. Don’t worry, it will all make sense soon.
Plus-Minus (PM) is a common NBA metric used to assess player ability through a team oriented lens. Instead of a metric that focuses solely on the points scored by a single player, PM quantifies how much a team outscores their opponents when a specific player is on the court. However, PM has flaws. For example, if a player often plays with elite players like Lebron James, their PM would obviously be higher than average players who didn’t have the fortune of playing with elite scorers. Wayne Winston and Jeff Sagarin created Adjusted Plus Minus (APM), a regression technique predicting point differential taking into account home/away bias and the other players on the court in a specific time segment to attempt to address this issue. Again, issues with collinearity (i.e., players that tend to be on the court at the same time), especially with players that play fewer minutes in a season, produce unstable and often incorrect results. Finally, Joseph Still proposed a new method: Regularized Adjusted Plus Minus (RAPM).
RAPM is essentially the same as APM except RAPM utilizes a common technique to combat collinearity in data. Regularization poses a practical prior assumption on the coefficients/plus-minus ratings of a player: their APM is average or, in other words, their coefficient is 0. In math terms, regression minimizes squared residuals (i.e. the error between what the model says and what actually happened), but regularized regression simultaneously minimizes the size of players’ coefficients weighted with a certain penalty. Why does this help us? The players with “inflated” APM that only play a couple minutes a game, but always play with Lebron James, Dwane Wade etc, will now have a RAPM closer to 0. Since these “coattail” players don’t play much, their effect on the total error in the model is extremely small, but since they often play with skilled players, their coefficient is large. A short amount of playing time provides little evidence to suggest coattail players should be deemed skilled by RAPM, so the prior assumption of average skills forces their RAPM closer to 0. So how does all this apply to romantic comedies?
Hopefully, you have already drawn similarities between basketball and movies. Much like basketball has many key players that switch in and out of games over a season, romcoms have different actors, some appearing together in multiple movies. The same collinearity concept appears in movies when two or more main actors appear in movies together.
The basketball to romcom comparison is not seamless. Romcoms don’t have score differentials for specific scenes like basketball has for possessions. There are two parts to this disparity: 1) Scores for scenes, and 2) Actors’ screen time per scene. While specific scenes aren’t rated by the public, there are endless movie ratings available online that should be sufficient to derive latent actor ratings. Since we don’t have per-scene movie ratings, actors’ per-scene screen time wouldn’t be all that useful. However, actor screen time is still an import element of quantifying an actor’s “value” since actors that only say a line or two don’t have lasting impressions that influence viewers’ ratings. Estimating screen time would require parsing all the movie scripts and counting the number of words for each actor. That is a project for another day. To combat some of the value lost with the all or nothing approach to movie based ratings, I include only actors from the top 10 of the closing credits. This allows only actors with meaningful screen time to appear in the model. Most importantly, actors aren’t everything. While the home team advantage has a small effect in basketball, numerous other factors influence movie ratings. I made sure to include these elements in my data collection and analysis.
I scraped IMDb data from the top 200 romantic comedies according to trusty IMDb user jw32. Movies on the list range between 1983 and 2014, and certainly cover all of my favorites. I gathered all the useful information about each movie: IMDb ratings by gender, number of votes, actors, plots, years, directors, writers, sub genres, content ratings, budgets, production companies, and movie duration. Let’s explore some of that data.
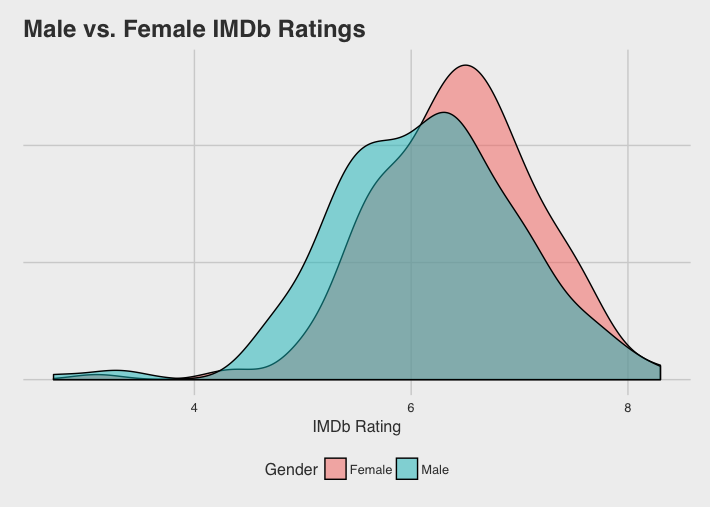
Unsurprisingly, females rate movies higher than males.
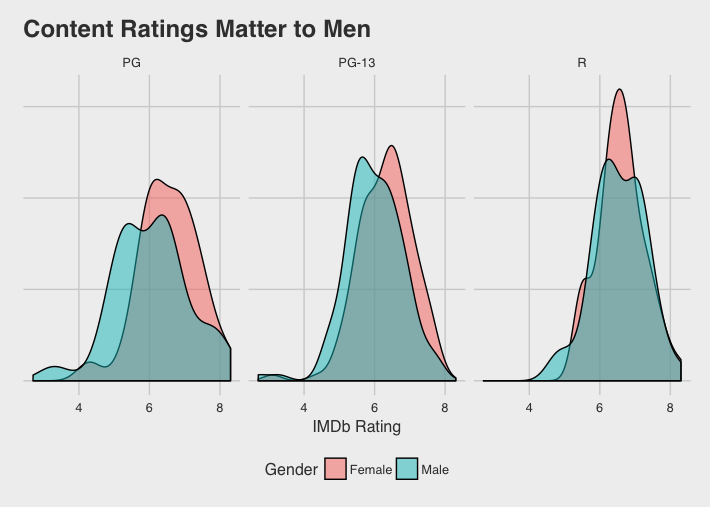
However, when we look at the movie’s content ratings males rate R-rated movies similarly. I don’t want to jump to any conclusions, but it’s probably because there is less mushy romance and more…well more R-rated scenes.
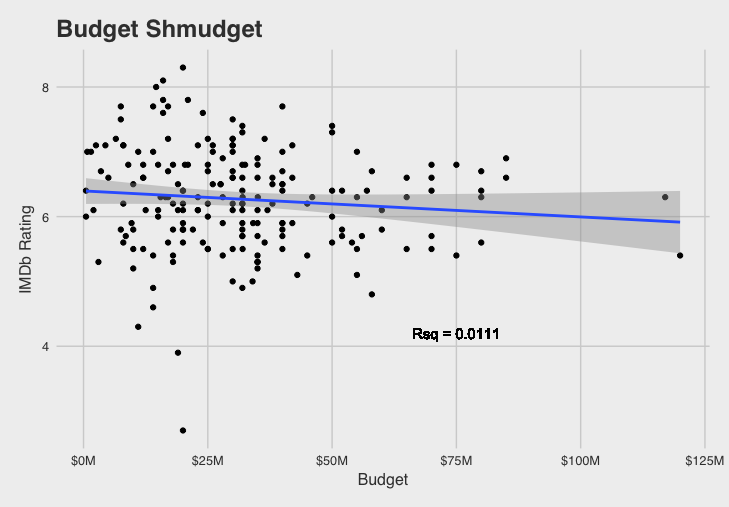
We see a slightly negative but insignificant relationship between IMDb ratings and movie budgets. Budget may matter more in fantasy or action movies with the need for more elaborate visual effects.
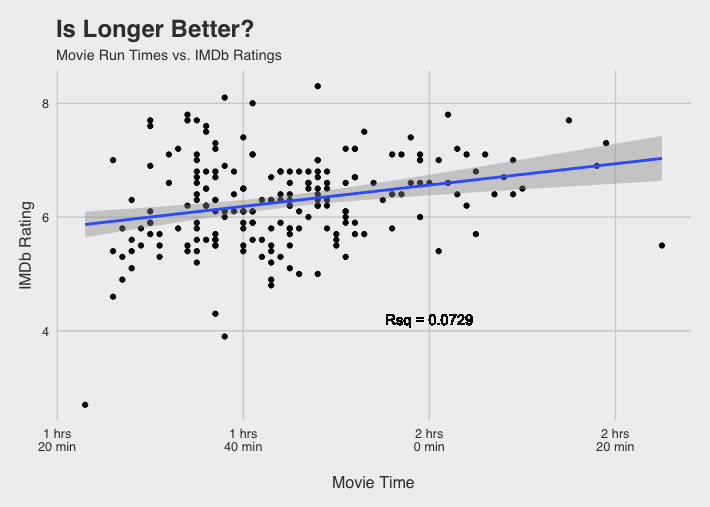
The data illustrates a slightly stronger relationship between movie times and IMDb rating. I usually associate short mainstream movies with poorly rated movies, like this years Emoji Movie (that I did not see) that lasts a whopping 1 hour and 26 minutes (and has an 8% rotten tomatoes rating). Maybe some lackluster movies try add fluff to reach an acceptable time length.
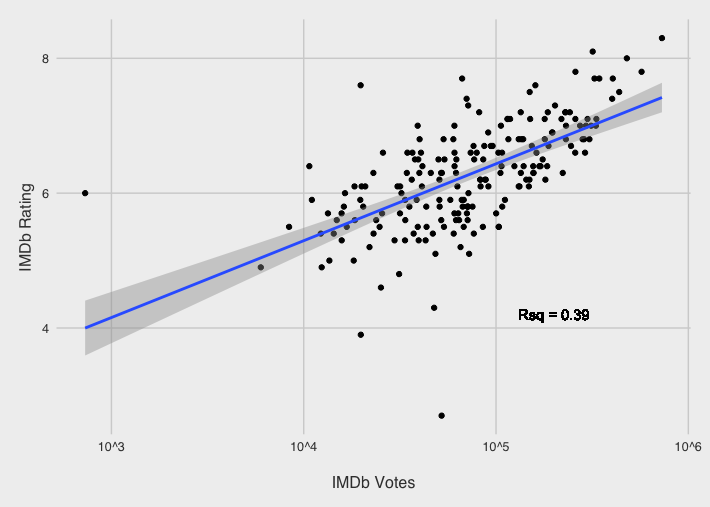
Finally, something a bit more meaningful surfaces when we look at the number of ratings for a particular movie. In general, more people tend to rate movies on IMDb when they enjoy them.
Besides the writers, directors, and production companies, the sub-genre and themes of the movie are the last elements that should be captured in the model. While the sub-genre is easy to capture — it’s listed on IMDb’s website — the themes of the movie are harder to extract. This is where we need the movie plot! Besides watching a trailer, the plot is next best way to decide to watch a movie because we can get a sense of what it’s about. Consider the following IMDb plot:
After a little white lie about losing her virginity gets out, a clean cut high school girl sees her life paralleling Hester Prynne’s in “The Scarlet Letter,” which she is currently studying in school – until she decides to use the rumor mill to advance her social and financial standing.
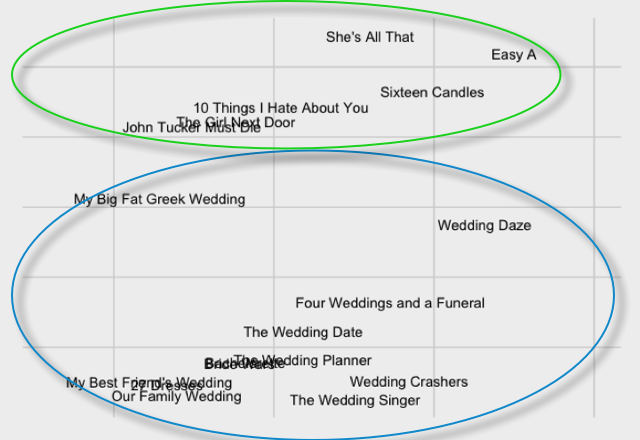
You probably recognized the story — it’s Easy A. All we need to see are words like high school, study, social, and girl to suspect that the movie is about high school social life. To incorporate these themes into the model, I utilized Latent Semantic Indexing which essentially maps words to a “topic space.” I’ll spare you the math lecture, but with this technique we can represent the thousands of different words in the 200 romcom plots in very few dimensions. Shrinking from thousands of dimensions to two, we can already see movies1 with the distinct themes of high school (green) and weddings(blue) cluster into their respective groups.
While romcom plus-minus (RC-PM) ratings take into account many of the elements mentioned above, these ratings might not exactly mimic viewers’ opinions of actors’ added value to romcoms. RC-PM might also partially represent the tendency of actors and actresses to constantly star in bad romcoms with unestablished directors and writers. Only directors and writers (and production companies) with consistently bad romcoms will divert a majority of the “blame” away from actors and absorb the effects in the model.
Below are the top 10 and bottom 10 actors by RC-PM. I only consider the RC-PM output for actors that appeared in at least 4 of the 200 romcoms as an additional adjustment to eliminate anomalies due to the lack of a screen time metric. Since IMDb rating distributions were quite different for males and females, RC-PM ratings are gender specific. The overall rating is the average of the male and female RC-PM.
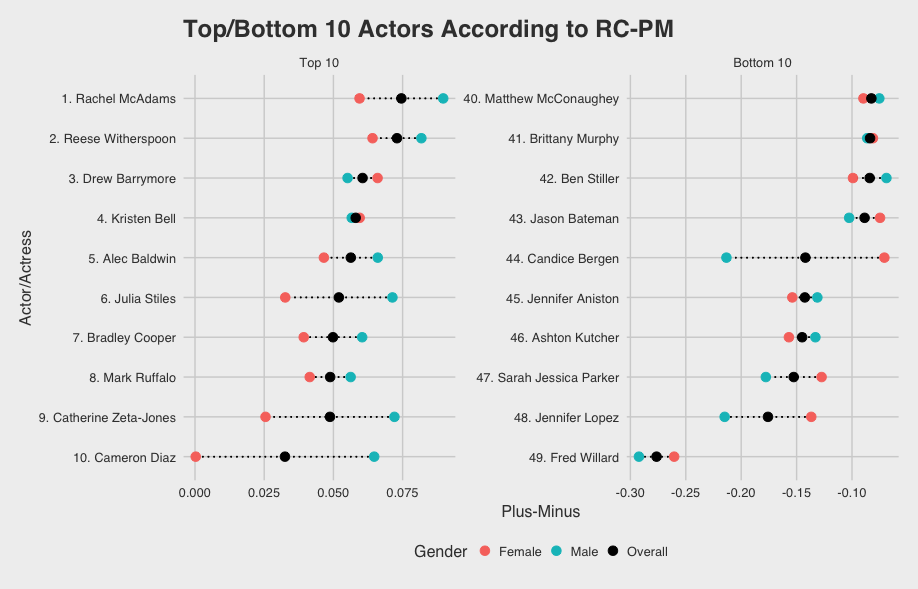
Examining the top and bottom RC-PMs, the magnitude of individual ratings are extremely different. The worst romcom actor, Fred Willard, is more than three times as bad as the number one actress, Rachel McAdams, is good2. Thus, Romcoms can only marginally improve IMDb ratings with top RC-PM rated actors. Maybe that’s why Hollywood tends to stack the credits with a ton of A-list actors.
I have included the full list of 49 actors and actresses with male, female, and overall RC-PM ratings. I agree with the ranking of Rachel McAdams and Sarah Jessica Parker, but there are certainly many in-between that could move up a couple spots. Let me know what you think. As always, if you are interested in the code behind RC-PM, you can find it here.
| Actor/Actress | Female RC-PM | Male RC-PM | Overall |
|---|---|---|---|
| Alec Baldwin | 0.047 | 0.066 | 0.056 |
| Amanda Bynes | -0.03 | -0.017 | -0.023 |
| Anna Faris | -0.038 | -0.045 | -0.042 |
| Ashton Kutcher | -0.157 | -0.133 | -0.145 |
| Ben Stiller | -0.099 | -0.069 | -0.084 |
| Bradley Cooper | 0.039 | 0.06 | 0.05 |
| Brittany Murphy | -0.081 | -0.086 | -0.084 |
| Cameron Diaz | 0 | 0.065 | 0.032 |
| Candice Bergen | -0.071 | -0.213 | -0.142 |
| Catherine Zeta-Jones | 0.025 | 0.072 | 0.049 |
| Chris Pratt | -0.018 | 0.027 | 0.005 |
| Colin Firth | -0.001 | -0.069 | -0.035 |
| Dennis Quaid | -0.011 | -0.016 | -0.014 |
| Drew Barrymore | 0.066 | 0.055 | 0.061 |
| Emma Stone | -0.01 | -0.023 | -0.016 |
| Fred Willard | -0.26 | -0.292 | -0.276 |
| Freddie Prinze Jr. | -0.071 | -0.08 | -0.075 |
| Gerard Butler | -0.008 | -0.026 | -0.017 |
| Heather Burns | 0 | -0.067 | -0.033 |
| Hugh Grant | -0.043 | -0.034 | -0.039 |
| Isla Fisher | -0.092 | -0.067 | -0.079 |
| Jason Bateman | -0.075 | -0.103 | -0.089 |
| Jason Biggs | -0.028 | 0.034 | 0.003 |
| Jennifer Aniston | -0.154 | -0.131 | -0.143 |
| Jennifer Garner | -0.043 | -0.026 | -0.035 |
| Jennifer Lopez | -0.137 | -0.215 | -0.176 |
| Jessica Biel | -0.077 | -0.012 | -0.044 |
| Judy Greer | -0.085 | -0.06 | -0.072 |
| Julia Stiles | 0.033 | 0.071 | 0.052 |
| Kate Hudson | -0.06 | -0.087 | -0.074 |
| Katherine Heigl | -0.008 | -0.019 | -0.013 |
| Kathy Bates | -0.065 | -0.002 | -0.034 |
| Kirsten Dunst | 0.004 | 0.036 | 0.02 |
| Kristen Bell | 0.059 | 0.057 | 0.058 |
| Lake Bell | -0.044 | -0.08 | -0.062 |
| Mark Ruffalo | 0.041 | 0.056 | 0.049 |
| Matthew McConaughey | -0.09 | -0.075 | -0.083 |
| Meg Ryan | 0.008 | -0.011 | -0.001 |
| Meryl Streep | 0.055 | 0.007 | 0.031 |
| Owen Wilson | 0.025 | 0.029 | 0.027 |
| Paul Rudd | -0.056 | -0.004 | -0.03 |
| Rachel McAdams | 0.059 | 0.09 | 0.075 |
| Reese Witherspoon | 0.064 | 0.082 | 0.073 |
| Rob Corddry | -0.02 | -0.021 | -0.02 |
| Robert De Niro | 0.034 | 0.001 | 0.017 |
| Sandra Bullock | 0.03 | -0.038 | -0.004 |
| Sarah Jessica Parker | -0.127 | -0.178 | -0.153 |
| Selma Blair | -0.025 | -0.026 | -0.025 |
| Topher Grace | -0.046 | 0.028 | -0.009 |