If you’re a baseball fan, you may have noticed you’ve been watching on average 10-15 minutes more baseball then you were 10 years ago. Or maybe you are always switching between games like me and never stop to notice. If you’re not a fan, it’s probably why you don’t watch baseball in the first place: 3+ hour games, with only 18 minutes of real action. You are probably more of a football guy/gal right? Believe it or not NFL games are even longer, and according to a WSJ study, deliver even less action.
The way the MLB is going, however, it may not be long before it dethrones the NFL as the slowest “Big Four” sport in America (and takes away one of my rebuttals to “baseball is boring”). Currently, the MLB is proposing pitch clocks and has suggested limiting privileges such as mound visits.
Before I get into the specific proposal and the consequences of these changes, let me give you some long winded insight into pace of play in the MLB.
A WSJ study back in 2013 broke down the game into about 4 different time elements:
- Action ~ 18 minues (11%)
- Between batters ~ 34 minutes (20%)
- Between innings ~ 43 minutes (25%)
- Between pitches ~ 74 minutes (44%)
The time between pitches or “pace” is what everyone is focused on, and rightly so. It makes up almost twice as much time as any other time element and is almost solely responsible for the 11-12 minute increase in game length since 2008. Don’t jump to the conclusion that this is all the fault of the batter dilly dallying or the pitcher taking his sweet time. This time also includes mound conferences, waiting for foul balls or balls in the dirt to be collected, shaking off signs and stepping off, etc. Even if we take all of those factors out, there are still two other integral elements that increase the total time between pitches: the total batters faced and the number of pitches per plate appearance (PA). If either of these increase, the total time between pitches will increase by default. In the graph below, I separated the effects of each by holding the rest constant to 2008 levels to see how each factor would contribute to the total time added.
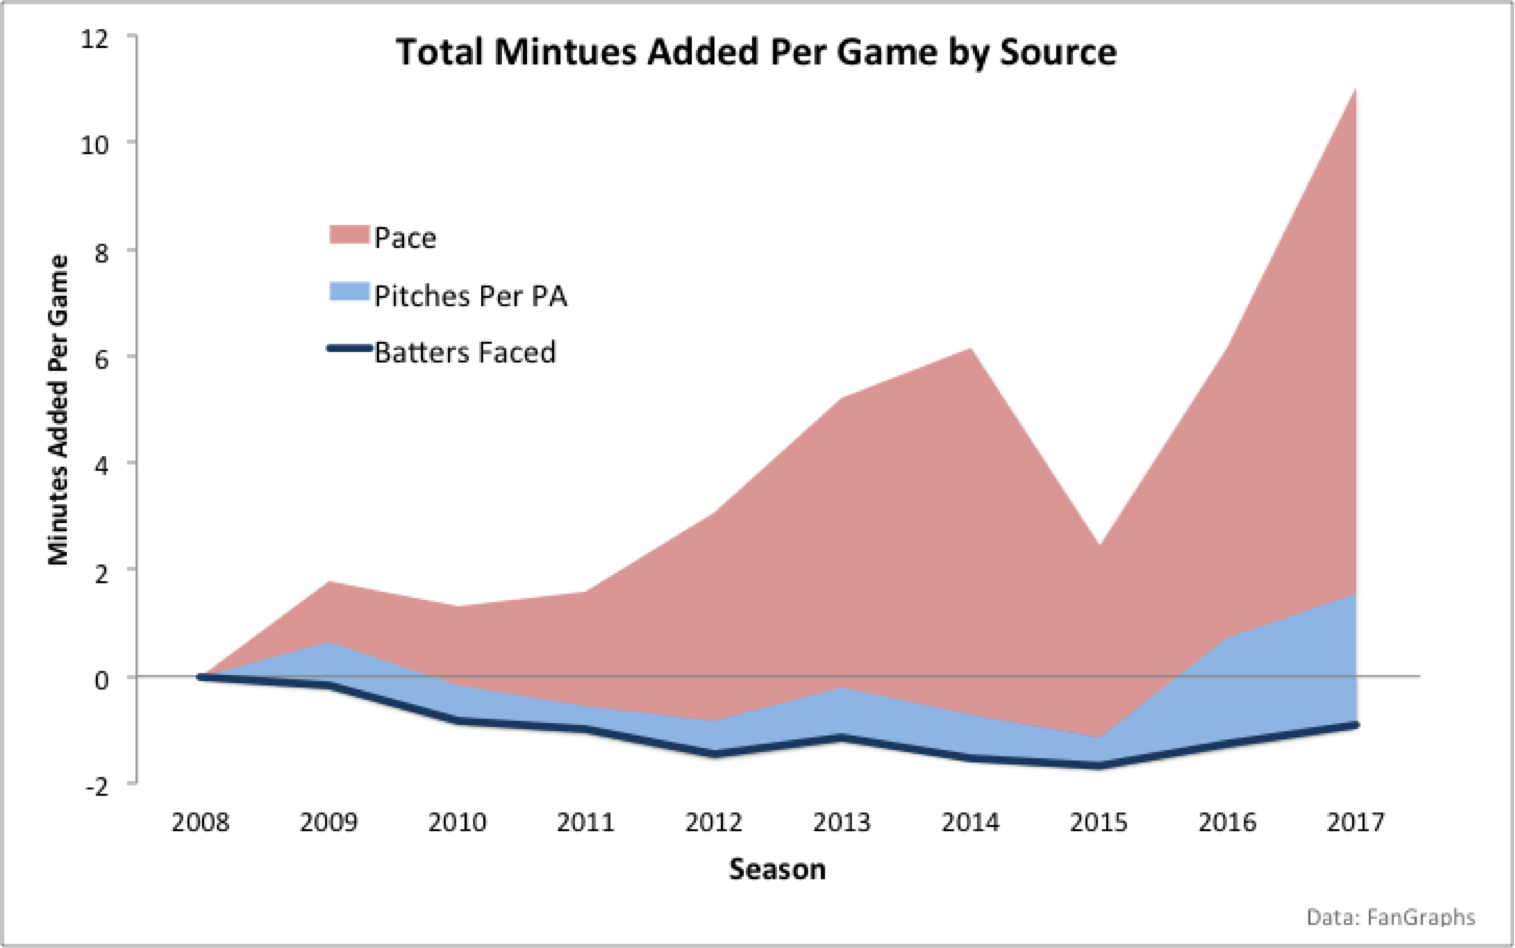
Any modest game time reduction since 2008 due to declining total batters faced was more than offset by a surge in pitches per PA. Still, the slowing pace between pitches accounts for most of the game time increase.
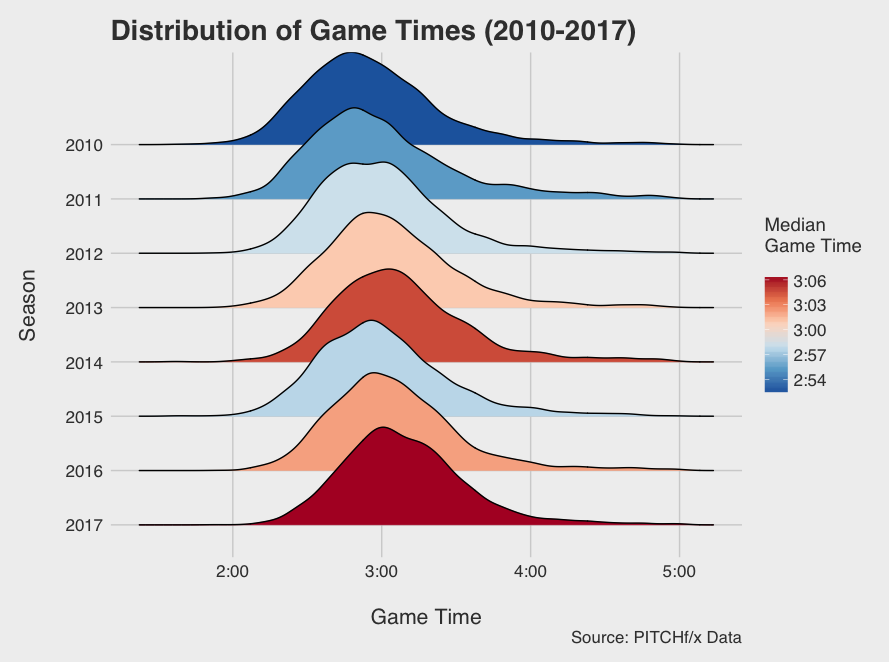
As we have heard over and over again in the baseball world, the average game time has increased and is evident in the graph above. It’s not just that the number of long outlier games has increased; the median game time has actually crept up by about the same amount.
Plenty of players are at fault for the recent rise in game time. You can checkout Travis Sawchik’s post about “Daniel Nava and the Human Rain Delays” or just checkout the raw player data at FanGraphs. Rather than list the top violators here, I thought it would be amusing to make a useless mixed model statistic about pace of play.
A mixed model based statistic, like the one I created in this post1, helps control for opposing batter/pitcher pace and for common situations that result in more time between pitches. Essentially, for the time between each pitch, we allocate some of the “blame” to the pitcher, batter, and the situation or “context”.
I derive the pace from PITCHF/x data, which contains details about each play and pitch of the regular season. I define pace as the time between any two consecutive pitches to the same batter excluding intervals that include pickoff throws, stolen bases, and other actions documented in PITCHF/x 2. For more specifics, as always, the code is on GitHub.
It’s a nice idea and all, but does context really matter?
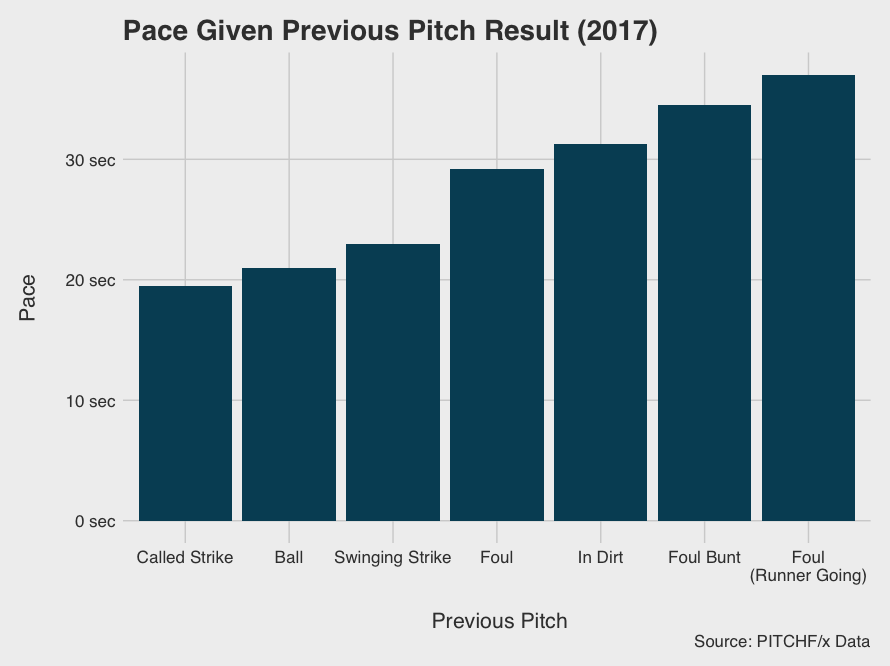
The most obvious example comes from looking at the previous pitch. Foul balls or balls in the dirt trigger the whole routine involved in getting a new ball, which adds even more time. The graph below clearly shows that time lags when pitches aren’t caught by the catcher.
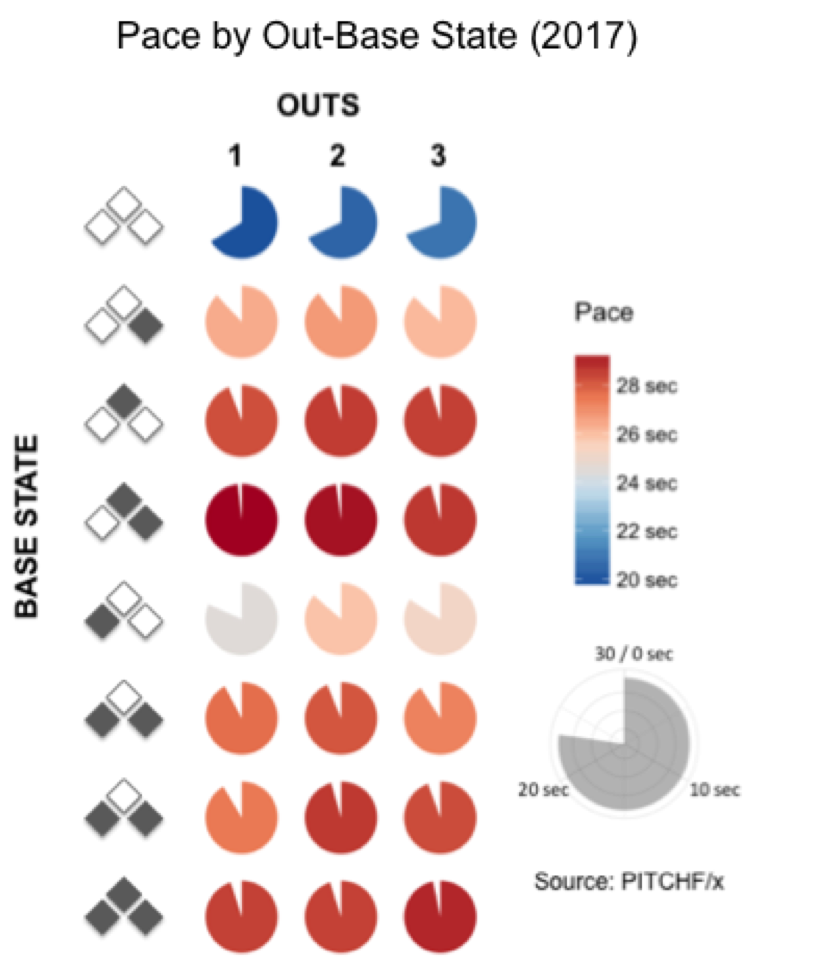
The biggest discrepancy comes with men on base. Even though pickoff attempts and stolen bases are removed from the pace calculation, it still doesn’t account for the games pitchers play with runners on base. This includes changing up their timing after coming set or stepping off the rubber to reset.
The remainder of the context I’ve included illustrates how pace slows with pressure and fatigue as players take that extra moment to compose themselves.
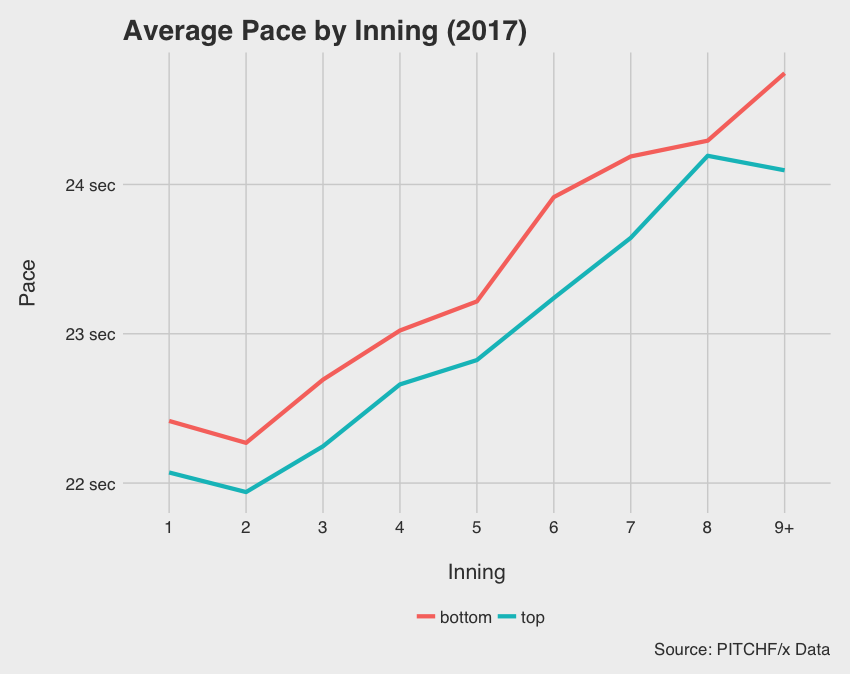
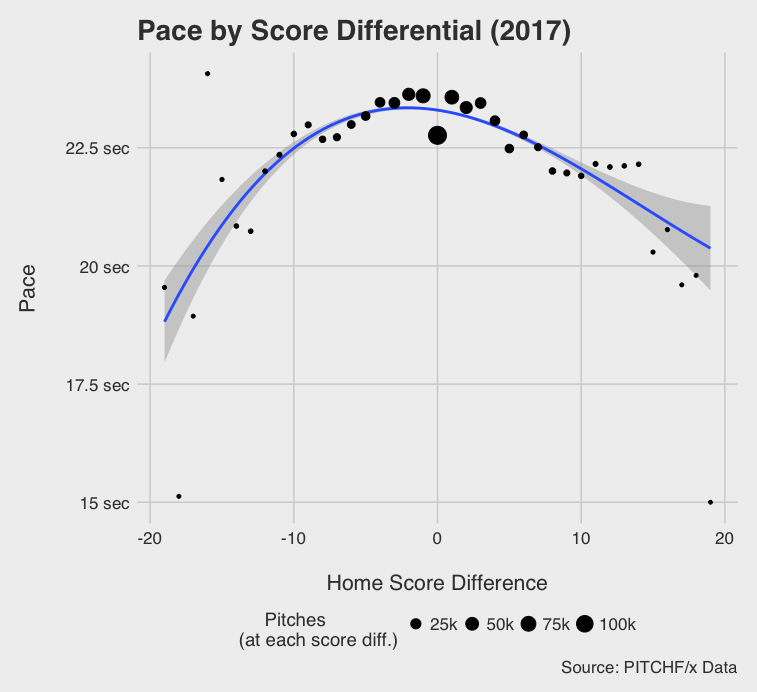
As the game approaches the last inning and the score gets closer3, time between pitches rises.
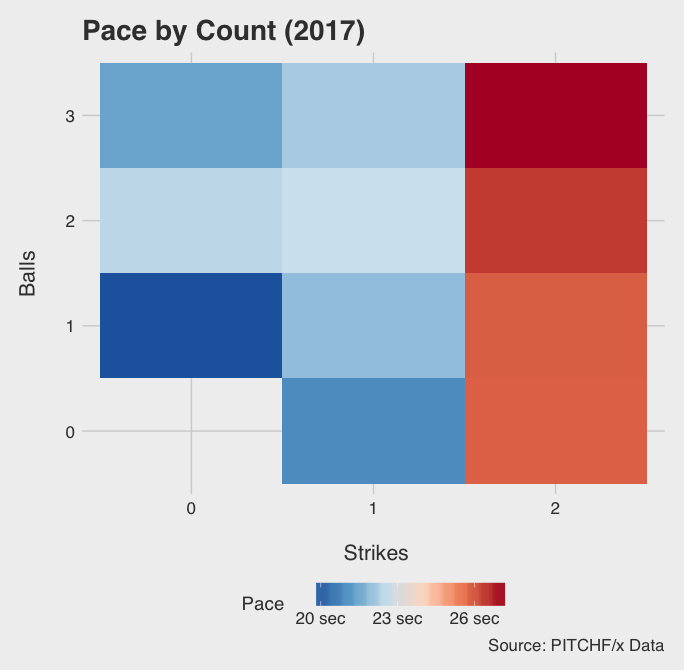
And similarly, as we get closer to the end of a PA from the pitcher’s point of view, pace slows.
Context plays a large part in pace meaning that some players who find themselves in notably slow situations, are not completely at fault. I created the mixed model statistic pace in context, or cPace, which accounts for all of the factors above. cPace can essentially be interpreted as the pace added above the average batter/pitcher, but can’t be compared across positions.
When comparing the correlation of Pace and cPace across years, cPace seems like a better representation of batters’ true tendencies. My guess is that, pitchers’ pace varies more than the average hitter, so many batters’ cPace values benefited from controlling for the pitcher and other context.
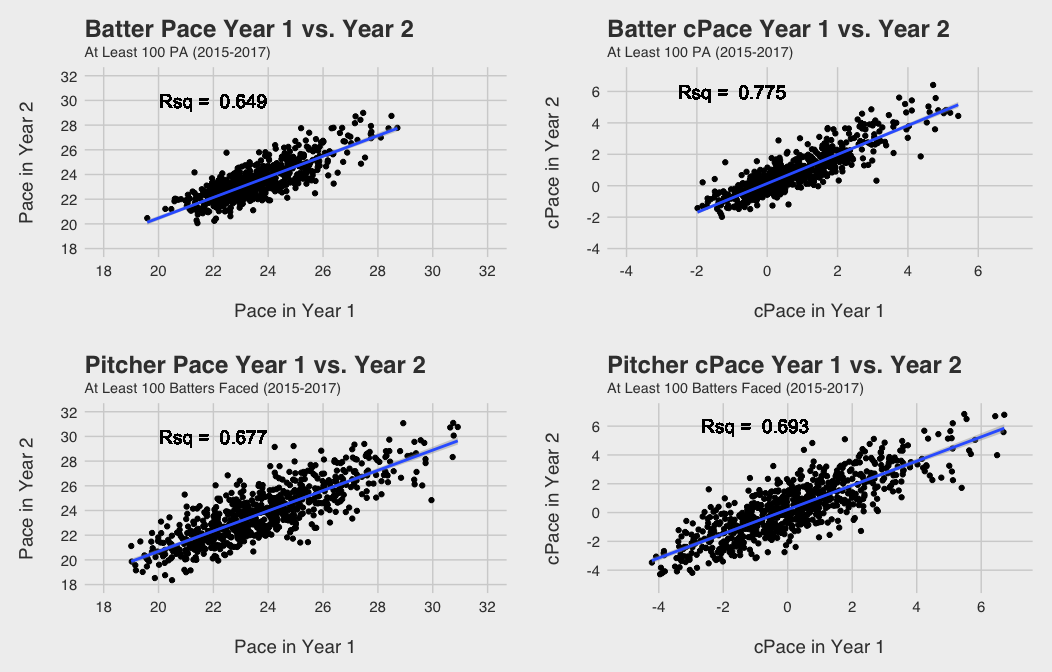
After creating cPace, I came up with a fun measure of overall pace: Expected Hours Added Per Season Above Average or xHSAA for short. It’s essentially what it sounds like: how many hours would this player add above average given 600 PA (or Batters Faced) in a season and league average pitches per PA (or BF).
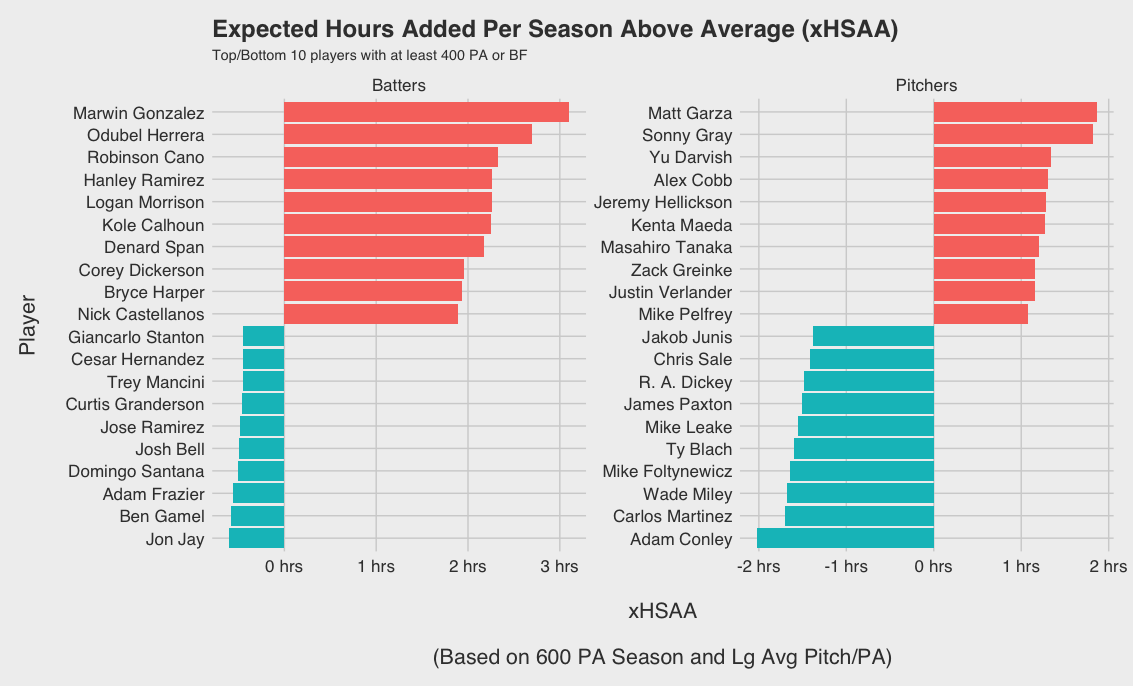
The infamous tortoise, Marwin Gonzalez, leads all batters with over 3 extra hours per season more than the average batter.
That was fun. Now back to reality and MLB’s new rule changes. Here is the latest proposal via Ken Rosenthal:
MLB’s latest pace-of-play proposal, per sources: No pitch clock in ‘18. If games are 2:55 or longer, 18-second clock for ‘19 with no runners on base starting May 1, with ball-strike penalty. If in ‘19 games are 2:50 or longer, additional 20-second clock with runners on in ‘20.
— Ken Rosenthal (@Ken_Rosenthal) February 1, 2018
The MLB tried to implement pace of play rules in 2015, one of which required batters to keep one foot inside the box with some exceptions. The rules seemed to be enforced less and less, but a 18 or 20 second pitch clock is not subjective and will potentially have drastic consequences for a league that averages 24 seconds in-between pitches. Some sources say the clock actually starts when the pitcher gets the ball. Since my pace measure includes the time between the last pitch and the pitcher receiving the ball, the real pace relative to clock rules may be 3-5 seconds faster.
Let’s assume that it’s 5 seconds to be safe. If a pitcher takes 20 seconds between two pitches, we will assume it’s 15 seconds. To estimate the percentage of pitches that would be affected by these new rules I took out any pitches not caught by the catcher, assuming all the pitches left were returned to the pitcher within the allotted 5 seconds.
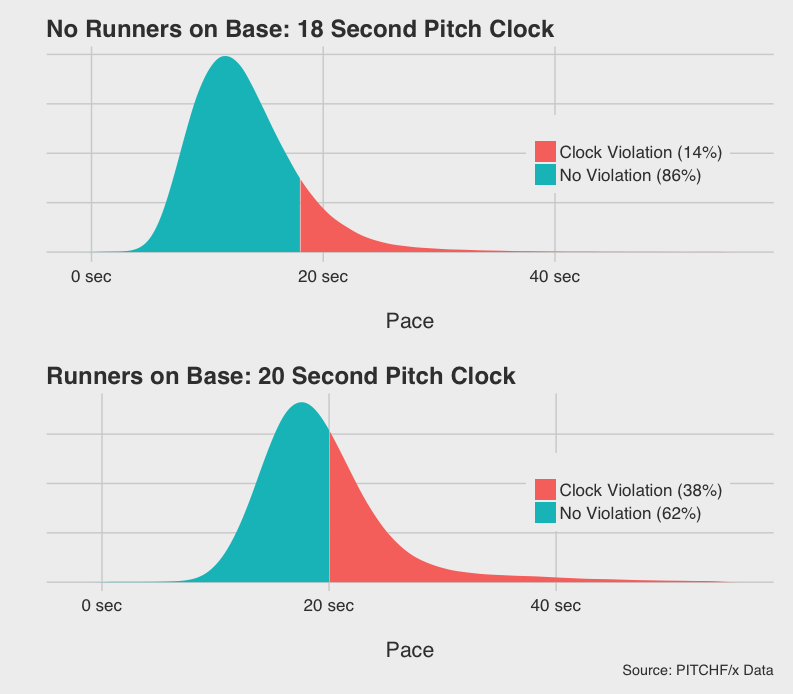
The 18 second clock results in about 14% of the pitches with no runners on in 2017 resulting in violations of the pitch clock. This doesn’t even include potential limits on batters times outside the box or time limits between batters, so we can safely say this is a lower bound. If both of the clocks are implemented in 2020, at least 23% of all pitches4 would be in violation of the pitch clock5. Assume it only takes 3 seconds to return the ball to the pitcher instead of 5, and that number jumps to 36%!
And now we are on the precipice of the 2018 season, which could produce the longest average game time in MLB history for the second year in a row as drastic changes loom ahead. I don’t know who decided that 3:05 was too long or that 15 minutes was a good amount of time to give back to the fans. Most likely just enough time for fans to catch the end of a Shark Tank marathon.
Anyways, if game times keep going up, something will eventually have to be done. However, even I, a relatively fast paced pitcher in college, worry that pitch clocks will add yet another element to countless factors pitchers already think about on the mound.
There are certainly some other innovative ideas out there: Ken Rosenthal suggests the possibility of using headsets for communication between pitchers and catchers, and Victor Mather of the NYT suggests an air horn to bring in new pitchers instead of the manager. Heck, maybe it’ll come down to limiting the number of batting glove adjustments per game. Whatever the league implements will certainly be a jolt to players’ habits and hardcore baseball fans’ intractable traditionalist attitude. The strategy, technology, and physicality of today’s baseball is changing more rapidly than ever. When the rules catch up, I have a feeling we will still like baseball.
-
Also see this article if you want an explanation of mixed models. ↩
-
This is very similar to FanGraphs’ definition, but they calculate pace by averaging over all pitches in the PA, while I calculate by pitch. ↩
-
With the exception of a score differential of 0, since this often occurs in the early innings. ↩
-
Excluding first pitch of PA ↩
-
Pitches with no runners on make up 60% of all pitches. ↩