Not often do we get the chance to witness live experiments mid-season on player performance, but that is pretty much what we have in the MLB sticky stuff crackdown. By intervening on one of the elements that we suspect contributes to pitching performance and keeping the rest constant, MLB has done some of the hard work for analysts. Though this isn’t quite an A/B test on sticky stuff, but it’s probably enough to come to some concrete league-wide conclusions.
When we analyze a treatment or a change we usually want to know the answer to a counterfactual question. For example, what would have happened to the strikeout rate for the rest of the season if there was no sticky stuff ban? Since we know what happens after the treatment is applied, this is basically another way of saying “what was the effect of applying a specific treatment or changing something?” Knowing the delta between the two scenarios is impossible, but techniques from causal analysis and experimentation are designed to help.
I’ll leave sticky stuff analysis to someone else and focus my efforts on a long forsaken1 controversy: the shift. The shifting surge has finally plateaued, sitting at 32 percent of plate appearances (PA) this year compared to 34 percent in 2020. Though there are a decent number of significant adjustments in shifting strategy on a team level, it seems as though we are closer to an equilibrium, and now may be a good time to check-in on how effectively teams are applying the shift. The shift fits the mold of a classic causal problem: teams are applying a treatment to players and we want to figure out if that treatment is effective. We have no way to run a randomized controlled trial, so I tried using some causal techniques try to get around this obstacle. Before attempting these methods, I first looked into how the shift has been analyzed in the past.
Historical Shift Analysis
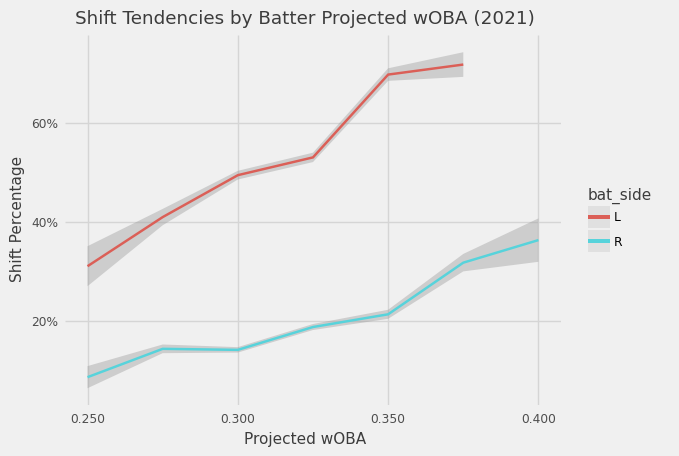
There has been plenty of great analysis that looks into interesting angles of the shift such as Justin Choi’s articles on the Padres and Dodgers. Sam Miller wrote a good summary of past work in his article at ESPN and more recently, so did Ben Lindbergh. Some of the past analysis of shifts ignores the confounding factors embedded in the selection of shifted players. For example, if we just compared wOBA during the shift vs normal alignment, this makes the assumption that we expect the two groups to have the same wOBA without the shift. As we can see in this graph below, there is a clear influence of skill or projected wOBA of batters on the decision by teams to shift or not.
Russell Carleton adjusts for some of these effects by changing the baseline BABIP to which they are compared. This might take care of the major underlying biases, but other effects like the opposing pitcher or certain elements of the batter’s profile may introduce further hidden effects. Tom Tango addresses this problem by using a WOWY analysis which looks at batter, fielding team, pitcher matchups and comes to the common conclusion that shifting against RHH is pointless and even detrimental. I think this is currently the best way to approach this problem since it controls for major factors and includes more players by not needing any minimum PA requirements.
With or Without You (WOWY)
Let’s first just recreate the process of Tom’s WOWY analysis to get a sense of what is going on here. For any year or collection of years we can take all the batter, fielding team, pitcher matchups with bases empty that had at least 1 PA with the shift and 1 PA with a normal alignment. Using the 2021 season (up to June 25th) we end up with only about 9% of all bases empty PA in our sample. To calculate the effect of the shift, we weight each matchups’ ($m$) individual effect by the harmonic mean of their shift and non-shift PA.
\[w_m = \frac{2}{\frac{1}{PA_m^{shift}} + \frac{1}{PA_m^{non-shift}}}\] \[effect = \frac{\sum_m w_m(wOBA_m^{shift} -wOBA_m^{non-shift})}{\sum_m w_m}\]Following this methodology we see a -56 point effect for LHH and +38 point effect for RHH which, based on the overall usage of the shift, results in just an 8 point advantage for fielding teams. As Tom points out, why are teams still shifting against RHH? Since our sample is such a small fraction of the PA in 2021 we probably have pretty big error bars on this estimate. I resampled the 2021 season 1000 times and re-ran the WOWY estimate to get a distributional estimate of these effects.
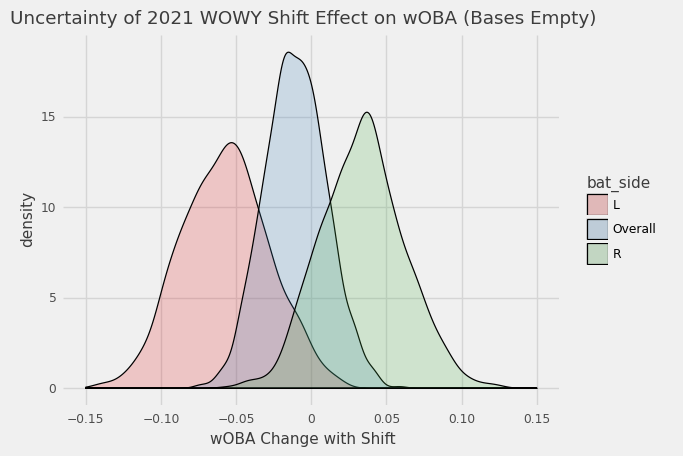
We can make some adjustments to try to boost the sample size. Another approach is looking at all PA regardless of the base state which results in -28 points for LHH, +42 points for RHH, +4 points overall, and tighter distributions2 with triple the sample size.
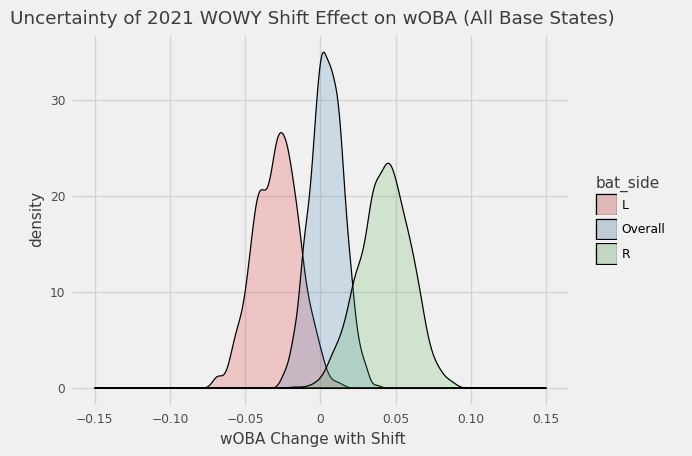
I have a few concerns using PA with men on base to estimate shifting effects on offense. We may not be capturing positioning advantages or disadvantages for creating outs with the runners already on base. Do they often take extra bases with the shift on? Are teams more likely to turn double plays? Do fielders position themselves a bit differenty? One way to fix this is just look at actual change in run expectancy (RE24) with and without the shift for these same PA. Scaling the wOBA effects to runs (divide by ~1.25) we would expect -.022 RE24 for LHH and 0.034 for RHH if there are no other base state effects.
| Method | LHH | RHH | Overall |
|---|---|---|---|
| Bases Empty (wOBA) | -0.045 | 0.030 | -0.006 |
| All Base States (wOBA) | -0.022 | 0.034 | 0.003 |
| All Base States (RE24/PA) | -0.023 | 0.014 | -0.006 |
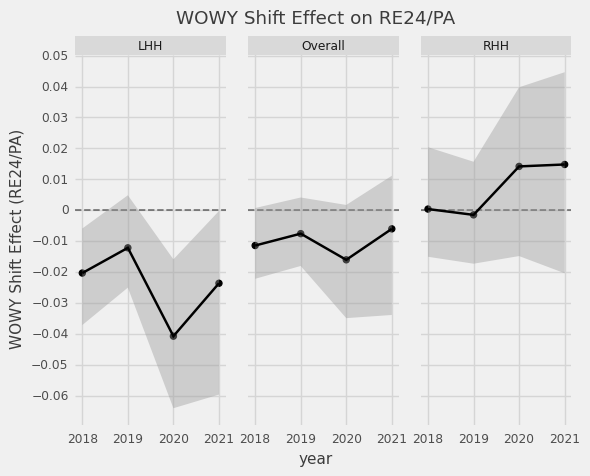
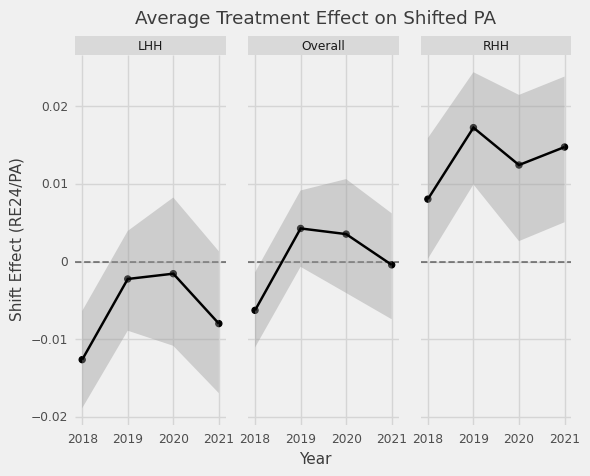
LHH effects are right inline, but on RHH we see a pretty big difference of 0.02 runs based on the actual change in run expectancy of those PA. Overall, the RE24 estimate tells us that the shift is worth around 1.1 win per year (given ~12 shifts a game), which could be 3 wins had teams stayed away from shifting RHH. Here is a more complete picture of the last four seasons shift effects and associated uncertainty (90% CI). In order to utilize more PA and reduce the uncertainty in my estimates, I turned to propensity scores.
Propensity Scores & Treatment Effects
When measuring treatment effects, we want to mimic a randomized control trial, but observational data is missing the guarantee of independence between the choice of treatment groups and the outcome. We can’t estimate the shift by simply looking at the expected difference:
\[\text{biased shift effect} = E[wOBA_{shift} - wOBA_{no shift}]\]Specifically, in the case of the shift, we know (probably) teams aren’t shifting players at random. The first graph illustrates that better hitters are shifted more often, so the treatment is applied in a biased way on factors that also affect the outcome of the PA. Therefore, we don’t have independence.
To achieve independence, we need to control for confounders — variables that could influence the decision to shift AND the outcome of the PA. WOWY does this for a few factors, but requires us to slice the data into multiple dimensions (pitcher, batter, team) which reduces our usable sample size and doesn’t estimate the effect of the shift on players that are shifted most of the time against all opponents.
This is where the propensity score comes in handy. The propensity score is the probability of a shift given our possible confounders, $X$.
\[\text{Propensity score} = \rho(x) = P(S|X)\]where $S=1$ for a shifted PA and $S=0$ for a normal alignment. Controlling for $\rho(x)$ is the same thing as controlling for X (a proof and more about propensity scores here).
If two different hitters have PAs with similar propensity scores, we would expect them to be comparable since they are equally likely to be shifted. Propensity scores can be used to weight our normal alignment PAs properly. PAs with high propensity scores that aren’t shifted are more relevant baselines for hitters that always get shifted.
What we are really trying to get at here is the effect of shift on players that are shifted ($S=1$) which is also called Average Treatment Effect on the Treated (ATT).
\[\begin{align} ATT & = E[wOBA_{shift} - wOBA_{no shift} | S=1] \\ \end{align}\]As we know, $wOBA_{no shift}$ is unobserved when $S=1$. After we do some expanding and simplification3 of this expression we can come up with an estimate for $ATT$ that only uses $\rho(x)$ and data we have observed.
\[\begin{align} ATT & = E\left[wOBA\left(S - \frac{(1-S)\rho(x)}{1-\rho(x)}\right)\right] \\ & = E[S*wOBA ]- E\left[\frac{wOBA*(1-S)*\rho(x)}{1-\rho(x)} \right] \\ & = E[wOBA|S=1]- E\left[wOBA\frac{\rho(x)}{1-\rho(x)}|S=0\right] \end{align}\]The first term is simply just the average wOBA for the shifted PAs and the second is a weighted average of the wOBA for the non-shifted PAs. Intuitively these weights make sense since $\frac{\rho(x)}{1-\rho(x)}$ quickly increases as $\rho(x)$ approaches 1, so PAs that are more likely to be shifted are given more weight.
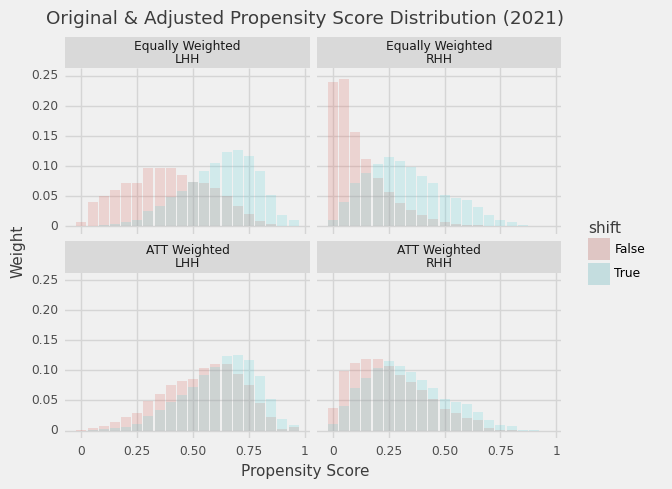
I’ll get to how I estimated propensity scores in a bit, but first I wanted to demonstrate how this works with the real propensity scores. The figure below shows a distribution of propensity scores for shifted and non-shifted populations where each group (e.g., shifted LHH) sums up to 1. The top row illustrates the disparity between propensity score distributions for shifted and non-shifted PAs. As we would expect, PAs with shifts tend to have higher shift probabilities. Once we reweight the non-shifted population accordingly (bottom row), the distribution more closely matches the shifted PAs.
Estimating Propensity Scores
So how do we estimate a propensity score for shifting? Since we are trying to predict when teams will shift, we can simply use any classification method that provides a probability estimate based on our set of confounders.
Since teams each have their own shifting strategy that may change year to year and LHH are treated very differently from RHH, I fit one model per team, batter handedness, and year. To decrease the computation time, reduce the possibility of overfit estimates, and ensure nicely calibrated probabilities I chose to use logistic regression over other classifiers.
I suspect that teams largely base their shifting decisions on batter profiles, and while I could quantify these with rolling averages, things might get a bit noisy for newer players or ones that don’t play as often. To create features that encode the best understanding of a player’s profile, I compute rolling daily projections that estimate players’ true talent for each day in 2018-2021. For example, to estimate HR% I
- compare expected and true variances to estimate how much to regress a sample to league average
- apply a decaying weight to observations from previous PAs over the last 3 years
- estimate rolling daily park factors for HR by handedness
- adjust past observations for park factors
I do this for all of the main PA outcomes that go into wOBA and apply a similar methodology (without park factors) to batted ball stats (pull %, gb %, pulled gb %, extreme pull%, etc.).
In addition to projected batted ball tendencies and outcomes for batters, I include HR%, BB%, K%, and GB% for pitchers and control for the base state. To simulate a teams understanding of the pitcher-batter matchup, I include an estimate of matchup wOBA based on batter and pitcher projections using an odds ratio.
Propensity Weighted Shifting Effects
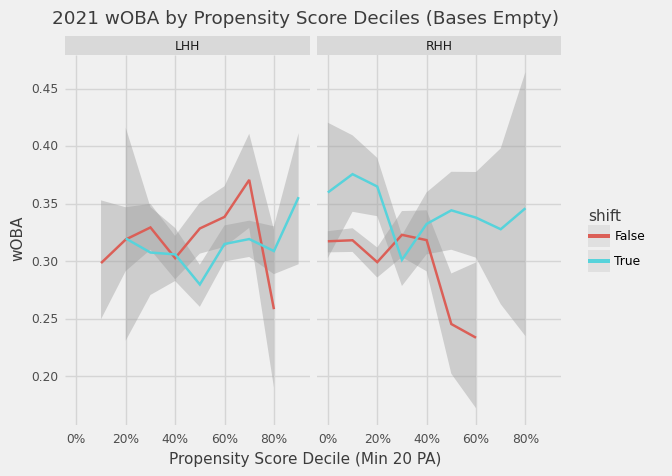
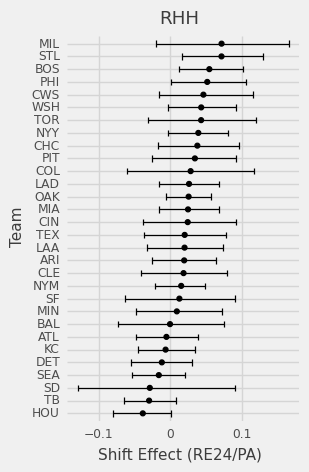
Given our estimated propensity scores, we can compare shifted and non-shifted groups that are close in propensity score to get an idea of shift effectiveness. Comparing the two groups across deciles in the figure below we can see the clear downsides of shifting RHH and evidence of a slight advantage for LHH.
Compared to WOWY the ATT for bases empty in 2021 indicates similar shift effects for RHH at +38 points of wOBA and more muted LHH effects at -22 points. I produced the same RE24 scaled table as in the WOWY section, but this time using ATT.
| Method | LHH | RHH | Overall |
|---|---|---|---|
| Bases Empty (wOBA) | -0.018 | 0.031 | 0.000 |
| All Base States (wOBA) | -0.012 | 0.026 | 0.001 |
| All Base States (RE24/PA) | -0.008 | 0.015 | 0.000 |
Again, we see smaller shifting effects on LHH compared to WOWY. We may be seeing some regression to the mean now that ATT utilizes all PAs in 2021. In the propensity decile graph above we see the benefits start to pay off at the 50% propensity mark, so it may be that teams just need to stick to shifting LHH that have extreme tendencies.
Higher variance in our estimate of ATT can arise when we have shifted and non-shifted groups where the propensity score distributions don’t overap much (before reweighting) and we see a bit of this at the tail of the LHH and RHH propensity score distributions. However, we can see ATT provides much tighter uncertainty estimates4 compared to WOWY (note the smaller y scale), but provide relatively similar conclusions:
- Only a slight benefit to shifting on LHH
- RHH should probably never be shifted
- MLB overall is not utilizing the shift to their advantage since they shift too many RHH
With larger samples, the causal approach also allows us to do some more granular analysis. For example, we can look at shift effects on different PA outcomes. Unsurprisingly, with the shift, LHH single about 20% less (2.6 percentage points), but at the same time, field outs barely move! Most of the outcomes are funneled to strikeouts (20% increase), HR (13 % increase), and walks (22% increase). Shifting on RHH gives negligible advantages to the fielding team on singles and field outs while decreasing strikeouts and increasing walks and HR.
| Outcome | Percentage Point Change | Percent Change vs Lg Avg | ||
| LHH | RHH | LHH | RHH | |
| HBP | -0.1 | 0.1 | -11.9 | 13.8 |
| BB | 1.9 | 1.8 | 21.6 | 23.6 |
| 1B | -2.6 | -0.4 | -19.4 | -2.7 |
| 2B | -0.4 | 0.3 | -10.2 | 5.8 |
| 3B | -0.2 | 0.04 | -39.5 | 10.3 |
| HR | 0.4 | 1.2 | 13.3 | 32.8 |
| Field Out | -3.4 | 1.8 | -7.4 | 4.0 |
| SO | 4.3 | -4.9 | 18.9 | -20.6 |
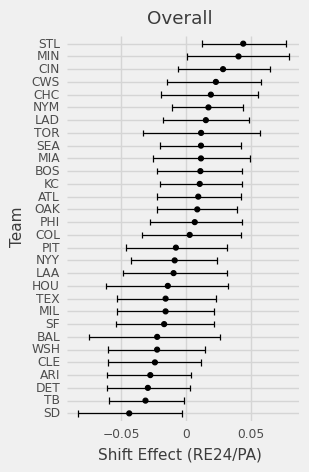
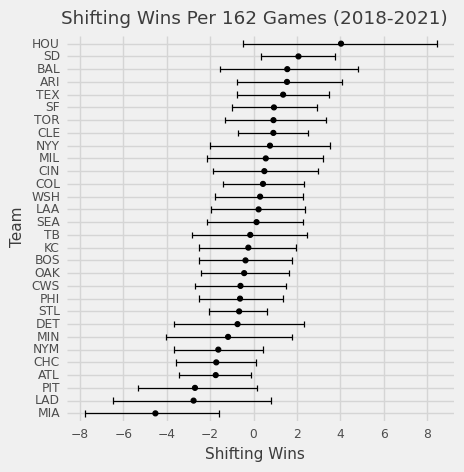
We can also evaluate team shifting skills and decisions by looking at team specific ATT.
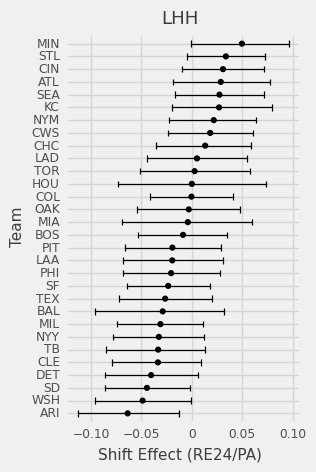
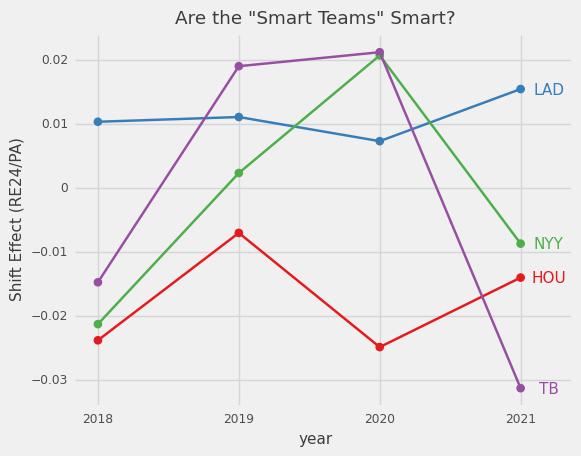
Which teams have generally improved or declined over the past 4 seasons?
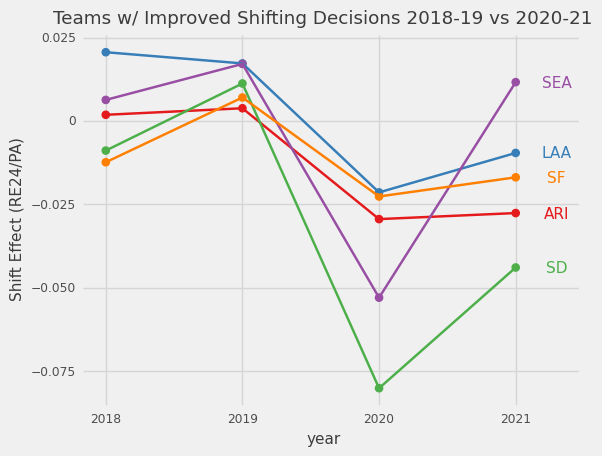
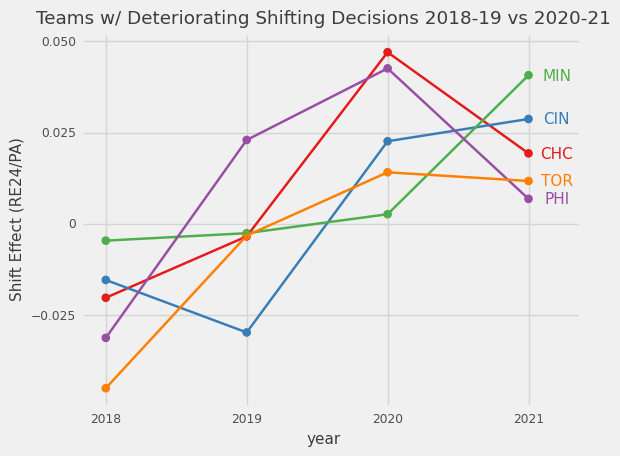
I also wanted to see if the so-called “smart teams” are actually benefiting from their strategies. Astros seem like they consistently make good decisions while LAD is surprisingly the opposite.
What really matters is does this help teams win? The shift, as it is applied on a league level, hasn’t been beneficial. On a team level over the past four years most teams’ 90% confidence intervals overlap 0 so we can’t make very definitive conclusions, but we can get a sense of who applies the shift well and often.
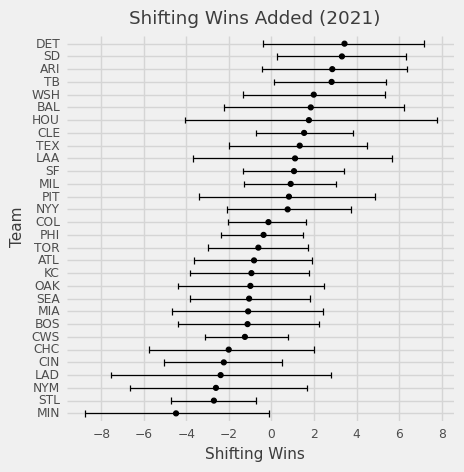
And here are the shifting wins by teams so far in 2021:
Finally, regardless of the methodology, we all come up with the same conclusion: shifts against RHH usually negate any benefits from shifts against LHH.
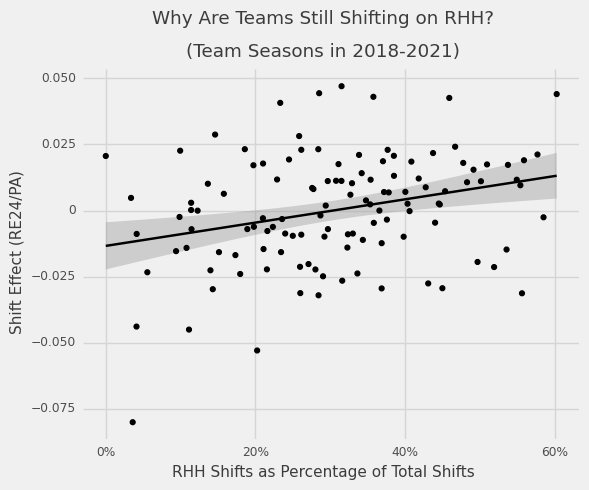
On average, shifting RHH is detrimental and there isn’t even convincing evidence that a small dose of RHH shifts would be an advantage either. With the exception of a few teams, the MLB as a whole has not had much success consistently shifting RHH in 2018-2021 seasons. Maybe there is some finer analysis to be done on specific hitters, maybe some teams have figured out the secret, and maybe teams should be running their own A/B tests or multi-arm bandits….but most teams can save themselves the headache by sticking to LHH.
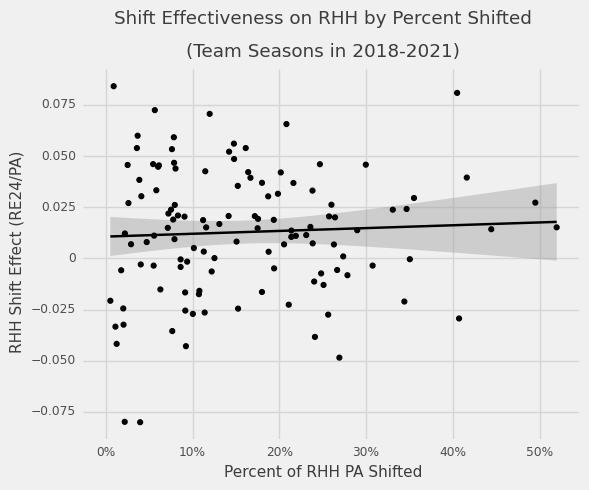
Photo Credit: Denis Poroy / Getty
Data Source: baseballsavant.com
-
I haven’t seen a “ban the shift” article since April 2021 ↩
-
I am quoting the point estimates. Distributions have slightly different mean estimates due to randomness. ↩
-
See some of the intuition behind ATT in these derivations and proofs (1, 2, 3) ↩
-
Standard deviation of ATT in 2021 is 0.0042 RE24/PA vs 0.0135 for WOWY ↩