After another year of baseball, another month of twitter arguments about what “MVP” means, and a great start to the postseason with three game fives, it’s time for the annual MVP prediction. If this is the first of my predictions you’ve seen, you are doing it all wrong! Go back here to see how my model works. Last year, wasn’t the toughest test of the model as there seemed to be clear winners. It did however predict both winners and 5 and 4 of the top 5 in the AL and NL respectively.
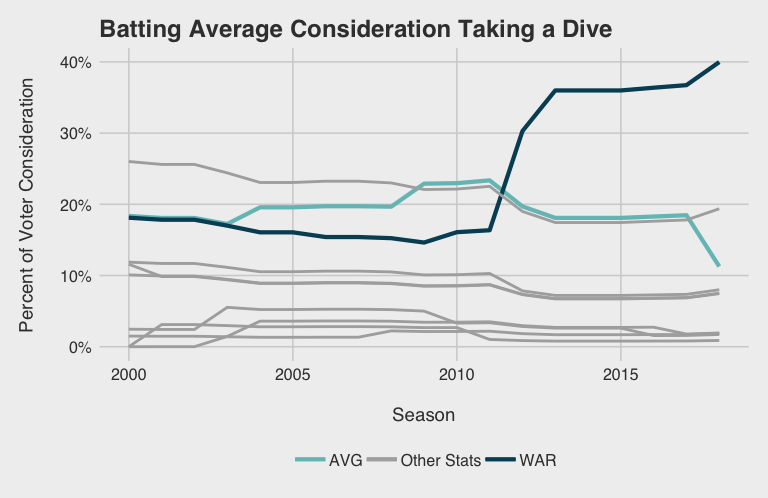
There are two primary changes we learned from voters in 2018: wins above replacement (WAR) is gaining importance and batting average (AVG) is losing importance. We can illustrate this by looking back at how weights have changed since the last vote based on the 2018 results1. We see a rather significant drop in the weights on AVG.
Even though the winners in the NL and AL had high batting averages (Yelich at .326 and Betts at .348), they had other things going for them. It wasn’t their sole differentiator. The key reason I think the weights finally changed was the distinction between 3rd place Jose Ramirez and 4th place J.D. Martinez. Martinez beat out or tied Ramirez in almost every category (R, RBI, HR, AVG, OBP, Win %). Their WAR values were not drastically close (7.952 for Ramirez and 6.15 for Martinez), but close enough to have a discussion. Ramirez had a .270 AVG, 60 points lower than Martinez’s at .330!
This year, it’s going to come down to a duo at the top of each league’s MVP race. I think most people in the industry would agree on that, and so does my model.
Unfortunately, the runner up in both leagues could have potentially won if they stayed healthy for the last month of the season. Mike Trout exited for the season in early September, missing about 10% of the season. Trout and Bregman have identical WAR, and with those extra games, Trout may have been able to pull ahead by one win. It seems like yet again Trout is the “2nd best player” this season, although not on a per game basis. Every year it takes a career year by another player to top him. Bregman kicked it into gear the last two months of the season with a 222 WRC+ and 4.2 fWAR. The main narrative that Trout will have to fight to win this year is team winning percentage and postseason appearances, which together constitutes about 16%3 of voter consideration.
A couple days after we lost Trout, Yelich went out with a season ending injury. Yelich probably would have ended up close to Bellinger in WAR if he stayed healthy. In terms of fWAR, their seasons are virtually identical. I use a combination of bWAR and fWAR in my model, and bWAR is much more optimistic about Bellinger’s defensive value. Now extrapolating outside what my model incorporates, what may tip the scales Bellinger’s way is:
- His unforgettable scorching start to the season with a 248 WRC+ in March and April with xwOBA largely in line with his performance.
- Yelich’s 2018 win. I suspect some bias against voting for the guy who won last year.
Yelich might have a chance because of “carry the team on your back” narratives, and he could receive votes just for the poetic way his sacrifice sparked the Brewers winning streak and postseason berth.
| Rank | AL | NL |
|---|---|---|
| 1 | Alex Bregman | Cody Bellinger |
| 2 | Mike Trout | Christian Yelich |
| 3 | George Springer | Anthony Rendon |
| 4 | Marcus Semien | Ketel Marte |
| 5 | DJ LeMahieu | Ronald Acuna Jr. |
I’m interested in a couple outcomes this year:
Will any pitchers show up in the top 5?
Pitchers need a lot of wins to get votes in the MVP race. It is usually dominated by hitters. I don’t think it will happen this year because Verlander and Cole will siphon votes from each other and probably don’t have enough WAR to get there. I think that opinions about how writers view offense is changing faster than how they view offensive vs. defensive contribution.
Where will DJ LeMahieu end up?
LeMahieu is 8th in the AL in terms of WAR and the model has him finishing 5th. The AVG certainly helps him get up to that top 5, but really, the team winning percentage and postseason appearance help him leap over Xander Bogaerts and Mookie Betts. It will be interesting to see how a big deviation from 5th will affect the weights on AVG and those team dependent factors in the future. Again, the “carry the team on his back” narrative plays here for some writers, which may introduce some noise. I did a quick test to see where he would end up with the weights from 2017, and his score decreased, but he didn’t budge from his ranking.
Photo Credit: Karen Warren, Perform Media Channels Limited