Mid-inning entertainment takes many forms in the MLB from The Freeze in Atlanta to the simple crab shuffle in Baltimore. These bouts of entertainment grab the attention of all fans regardless of age no matter how trivial or silly they may be. I always think to myself, who cares which subway train wins on the scoreboard at Yankee Stadium? Yet when the three trains start their engines on the jumbotron, I’m calling out my winning pick to my friends to secure that everlasting glory I somehow get from randomly picking a train and winning 1 in 3 times.
As a proper data scientist, the next question I ask myself is how do I get an edge? How are these races decided and who decides them? Are the winners predetermined? The hometown Nationals Presidents Race is the perfect example to examine. Besides having little dependence on skill, like The Freeze, these races always seems to have a story line: some planned out elaborate scheme that trips, distracts, or disqualifies a president. There must be some method behind how the Nationals plan this race, and I am going to get to the bottom of it.
Anyone that is familiar with the Presidents Race knows that Theodore (Teddy) Roosevelt bears the brunt of most of these mysterious and often ridiculous mishaps. Fans even created a movement, “Let Teddy Win,” protesting Teddy’s 7 year-long losing streak.
Here is some quick background on the race:
- Takes place in the middle of the 4th inning of every home game (and 13th inning).
- The main presidents included in the race are the four from Mount Rushmore (George Washington, Teddy Roosevelt, Abe Lincoln, and Tom Jefferson)
- Other presidents have raced and retired including Coolidge, Taft, and Hoover.
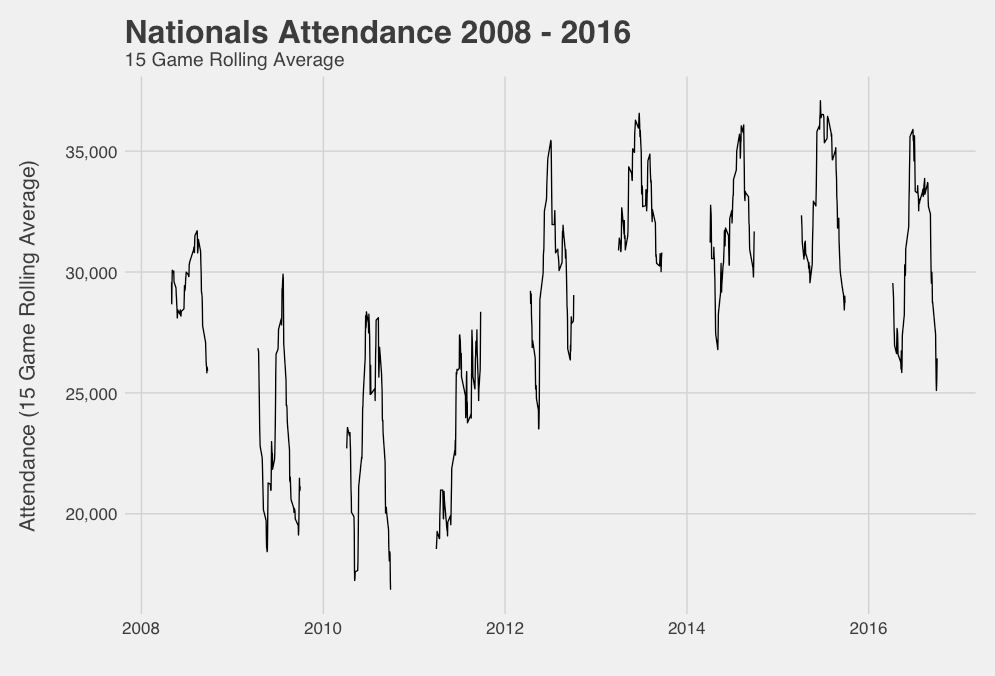
Thankfully the data collection for the Presidents Race is consistent, which is part of the reason I chose it. I gathered historical racing data from 2008 – 2016, certainly enough to weed out some patterns. To supplement this data, I pulled play-by-play baseball data from my Retrosheet1 database which should add some context such as game attendance figures, win-loss records, and in division match-ups which may influence the Nationals race outcomes.
Lets take a look at the overall standings2 in the past 9 years to get an idea of how often certain presidents win overall. I grouped all the retired presidents and guest racers into the ‘Other’ category and excluded races with ties or multiple winners (e.g., relays).
| President | Wins | Win% |
|---|---|---|
| Abe | 253 | .351 |
| George | 170 | .236 |
| Tom | 153 | .213 |
| Teddy | 79 | .110 |
| Other | 65 | .090 |
Abe is the obvious front-runner winning over 1/3 of the races, getting off to a quick start in the first two seasons of live racing in Nats park.
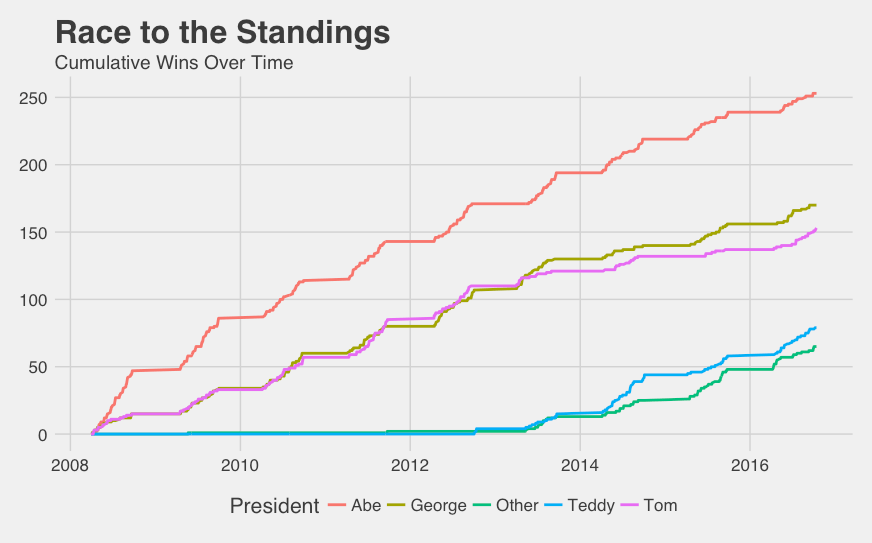
Besides the noticeable slow start by Teddy and adoption of other presidents and non-president participants3, some of the paths to the current standings — specifically Abe’s — tend to have some steep slopes which would signify streakiness. Comparing future winning percentage conditional on past winning percentage reveals that all four core presidents have some streakiness qualities, but none as strong as Abe’s.
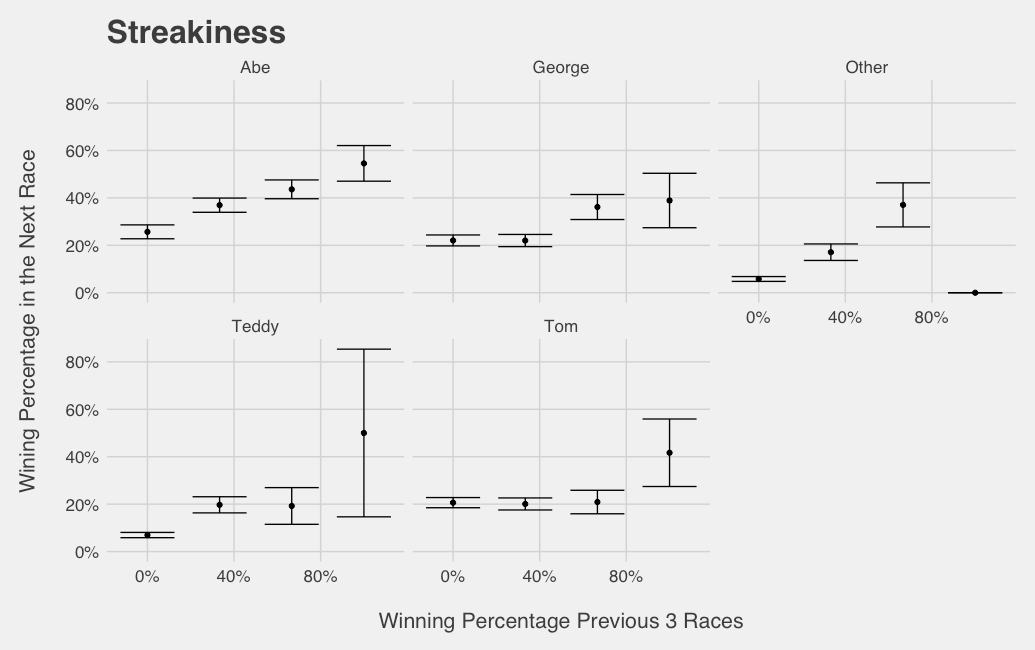
Abe is the only president that has a completely increasing relationship (when factoring in 95% confidence intervals) between previous race win percentage and the likelihood of winning next race. When Abe wins the last race, he has a winning percentage of 43% in the next race, and when he wins the previous two, his winning percentage increases to 48%. This phenomenon will come in handy when we attempt to predict the winners. While Abe, George, and Tom have at least a 1 in 5 chance of winning having won none of the previous 3 races, Teddy and other contestants’ win percentage in the same situation is predictably much smaller due to the long drought illustrated in the “Race to the Standings” graph.
Teddy won his first race on October 3rd, 2012 to a large crowd of over 37,000 fans at the end of a .600 season with the Nationals down one in the 4th inning. What part of that context matters? Is the race already decided? Streakiness definitely doesn’t explain everything. The Nationals are losing and they need a thin crowd to get up on its feet; will they let Teddy win? Race outcomes may be a consequence of attendance, excitement, and other in-game context. If I were a Nationals executive, I would certainly want to pump up the crowd in a nail-biter between division rivals. To investigate this narrative, I investigated performance by attendance figures and scores in the 4th inning during every home game.
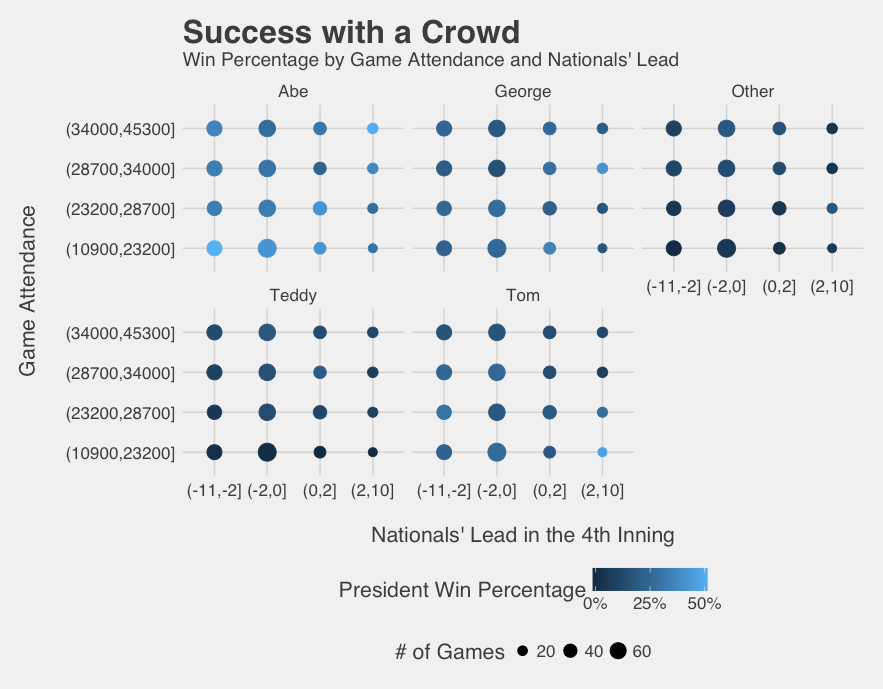
Although it seems that this is not the breakthrough I was looking for, there seem to be some interesting patterns when it comes to George, Abe, and Tom. Based on these scenarios we could possibly rationalize guessing Tom in low attendance games the Nationals are already winning and choosing Abe in the two extremes: high attendance games in which the Nats are ahead and low attendance games in which the Nats have fallen behind. Low attendance abnormalities in Abe’s case might stem from his glory days in the ’08 and ’09 seasons winning over half of the races in an era of lower attendance!
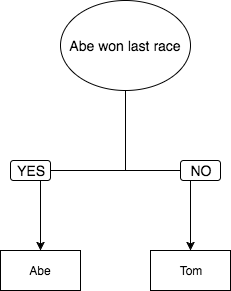
I could continue going on about additional factors that may or may not predict the winners, but you would probably like me to get to the point. How do you achieve bragging rights? How do you become a champion? Well I’m going to let you figure that out for yourself, but first let me give you the tools to do it, specifically, an algorithm. Its called a decision tree. If you don’t know it by name it’s actually an algorithm that you see or use every day without knowing it. Here is a fun example of one. A decision tree is a sequence of yes or no questions that leads you to an answer. The decision tree below represents a simple algorithm that leads to a specific president based on a condition: “Did Abe win the last race?” If the answer is yes, the choice is Abe, otherwise, the choice is Tom. Simple right?
Our goal is to create the best decision tree, or in other words, one that picks the winner with the highest accuracy possible. Decision trees are often not the best models for achieving the highest accuracy, but I chose it because the output is easily interpreted and applied quickly to real world situations. Ensemble models, or models with weights and logistic functions could be a mess if trying to calculate your pick in the stands on a napkin.
A decision tree model is a predictive algorithm that is designed to learn the best variables on which to make decisions resulting in correctly predicted race winners. To find the best decision tree and to quantify its effectiveness, I leave out approximately one season worth of data4 to test the model as if it was a collection of future races.
Before we delve into the different decision trees for predicting winners, I must point out that the best decision tree had an accuracy of 37% on the unseen season of data, 17% better than the naive model (guessing each president with 20% probability). However, Abe wins so much that guessing Abe at each race would achieve an accuracy of 36%. If your goal is to exert the least amount of energy, this is the strategy for you. Those who want to go the extra mile for the extra percent of accuracy here is a solution:
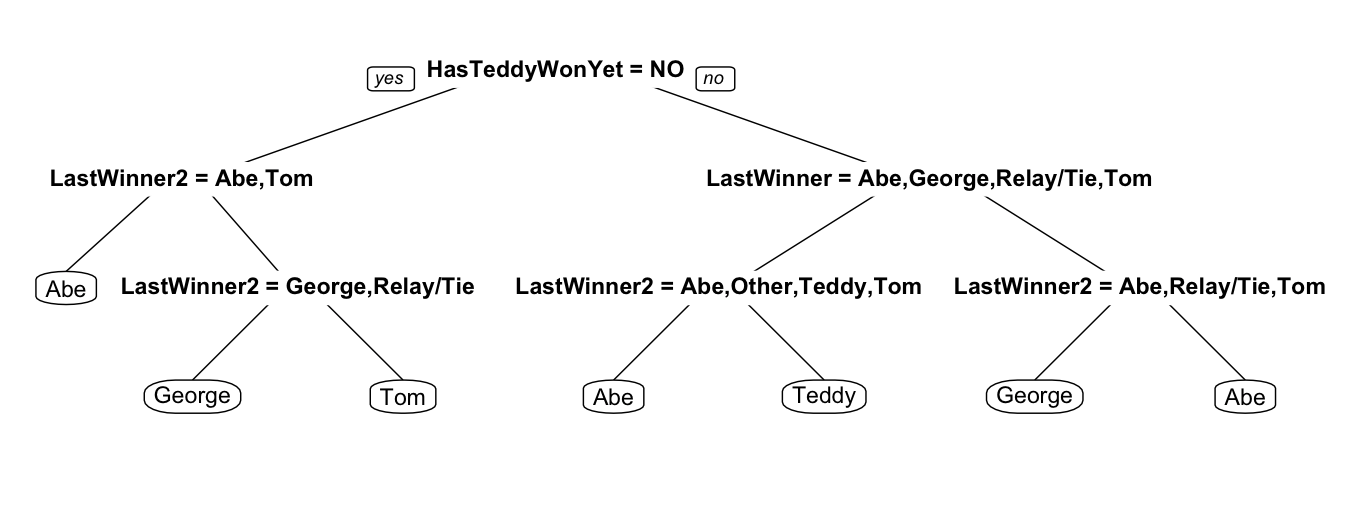
Variables: HasTeddyWonYet – 'Yes' if Teddy has won a race this season. LastWinner – Winner of the last race. LastWinner2 – Winner of the race before last.
To make sense of the tree above, treat each node as a question or a condition moving down and to the left if the answer is yes (or the condition is true) and right if the answer is no (or the condition is false) until you arrive at a leaf with a president’s name – your optimal choice. Here is an example of how you might choose your president:
- Has Teddy not4 won a race yet? Yes, he has not won a race this season.
- Was the winner 2 races ago Abe or Tom? Nope, it was George.
- Was the winner 2 races ago George, a relay race, or a tie? Yep, it was George.
- Guess George
One measly percent might not be worth all this effort. And what is it for? Bragging rights? Lets make it more interesting with some real payouts. Yes, I’m talking about betting on the Presidents race. It won’t be long before Vegas makes the lines, so let’s get ahead of them and make our own rules. Creating payouts for different bets won’t be too hard. It just needs to be a betting structure that doesn’t reward putting all your money on Abe, the lazy strategy. Lets assume that for each president the payout is $\frac{1}{P(Win)}$ if you guess correctly and $\frac{-1}{1-P(Win)}$ if you guess the same president incorrectly. This betting structure ensures that if you continue to only bet on one president, and he continues to win roughly the same proportion of races, your profit will be approximately 0. In this case, correctly guessing Abe results in a 2.82 dollar reward while guessing Abe incorrectly deducts 1.55. On the other hand, guessing Teddy correctly results in a much higher compensation of 9.82 but a loss of only 1.11 if Teddy is the incorrect choice.
Conquering this betting structure requires strategy. Our decision tree can help us figure out when its worth it to bet on Teddy or when its better to play it safe with Abe.
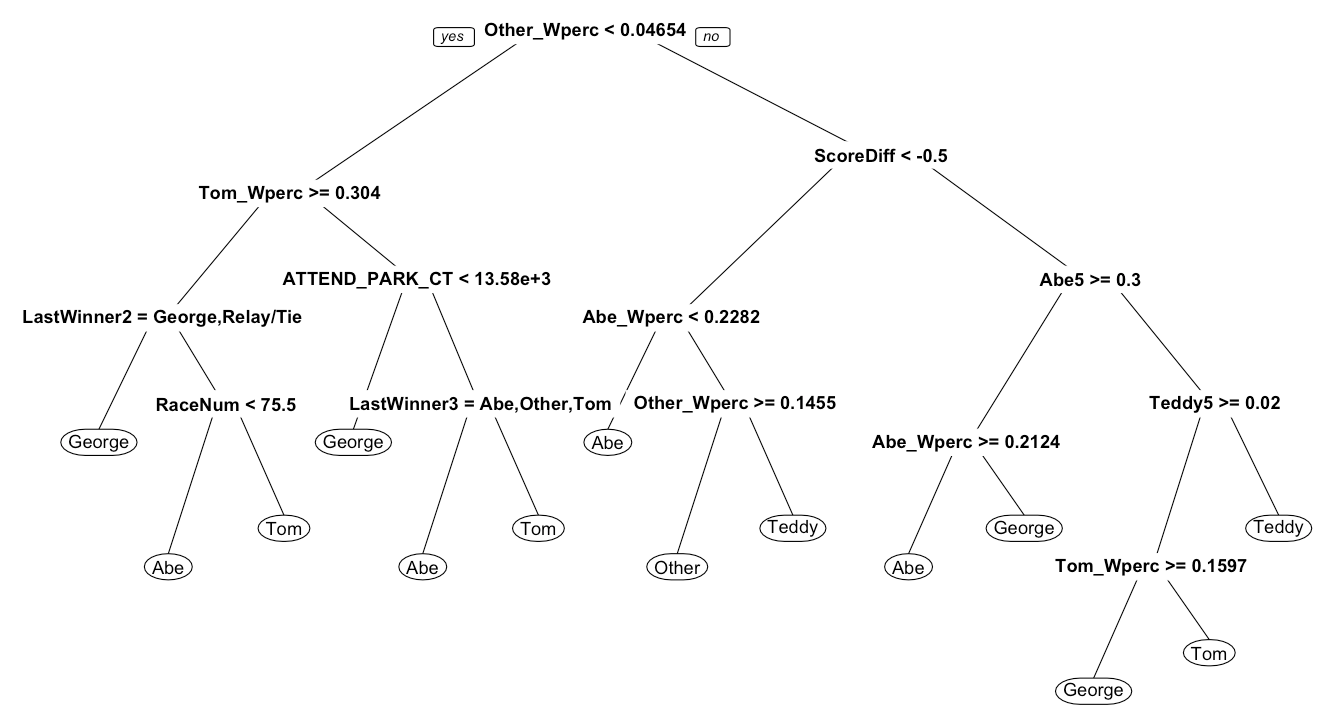
The decision tree algorithm has produced a much more complicated strategy based on the new cost structure. Based on its performance on the hold out sample, this new strategy nets an average 1.34 expected profit per game or 108.53 per season. If those numbers seem low to you, multiply all the payout structures by 1000. Ultimately, your fellow betters in the stands have to agree to this payout structure for this to work. But just in case, I have created a simple RShiny app that you can customize with your own variables and payout structures here. I even provided the option to explore a binary scenario: Teddy vs. Not Teddy if you are looking to really entice others to play with a false sense of security. I have listed all the variables available in the app and their descriptions below. Additionally, the code is available on my github repository.
Of course, tendencies may shift, management may change, and all these strategies may become worthless. It was fun while it lasted. If you plan to implement what you have learned, remember me when you become a millionaire. If you just enjoyed a light read about something completely useless, please come back to sharpestats for more of the same!
| Variable | Description |
|---|---|
| START_GAME_TM | Time the game started in military time |
| ATTEND_PARK_CT | Attendance at Nats Stadium |
| InDivision | Current game is against a division rival |
| HasTeddyWonYet | "Yes" if Teddy has won yet in the current season |
| LastGameScoreDiff | Nats score difference in the last game. If the Nats win the difference is positive |
| NatsWinPerc | Nats current season winning percentage (first game is considered .500) |
| ScoreDiff | Nats lead in the 4th inning |
| RaceNum | nth race this season |
| LastWinner | President who won the last race |
| LastWinner[n] | President who won n races ago |
| [PresidentName] | President win percentage in the last 3 races |
| [PresidentName]5 | President win percentage in the last 5 races |
| [PresidentName]_Wperc | President season win percentage as of current game |
Featured image by Scott Ableman